The Night It Started
The power went out at 2:47am on a Tuesday in February 2023. I know the exact time because I had a monitoring app running and the alert woke me up. I lay there for a few seconds doing the mental math. Outside it was 11°F. I had 68 percent charge on my main unit. I had a full day of solar ahead, assuming the sun showed up. I thought I was fine.
I was not entirely right. I went back to sleep without checking the panels, without thinking about the frost-free refrigerator’s defrost cycle, and without considering what February sun angles actually do to a fixed-tilt panel array in rural Nevada. Those three oversights were going to make the morning interesting. The margin I thought I had was not the margin I actually had, and the difference between the two was going to play out over the next seven hours.
The Setup I Had That Night
For context, here is what the homestead was running on when the outage hit. This is not a buying list. It is the specific configuration that was about to get stress-tested.
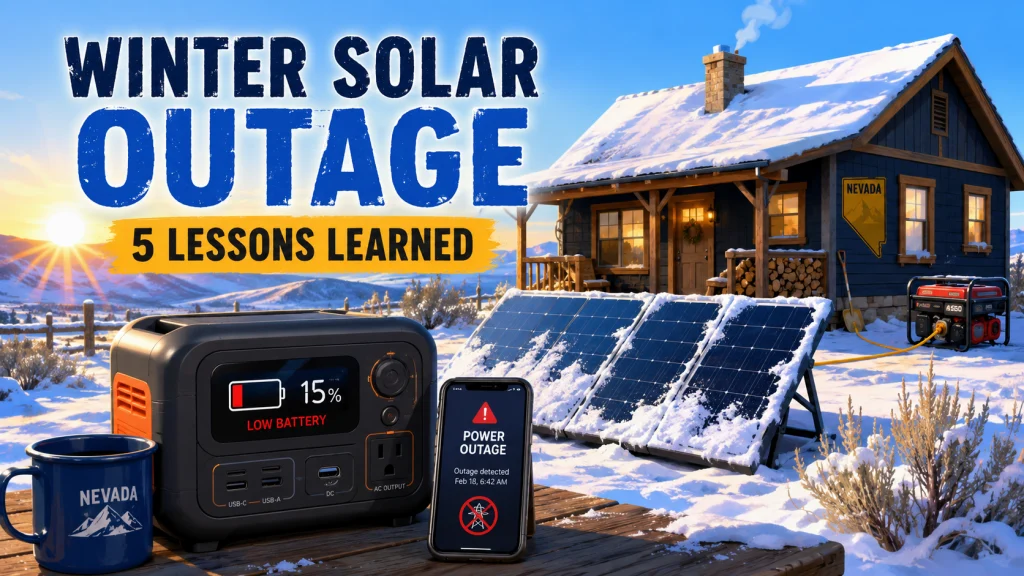
- Main unit: LiFePO4 battery, approximately 2,000Wh usable capacity. At 68 percent charge that was roughly 1,360Wh available going into the outage.
- Panels: two 200W panels, 400W total rated. Fixed tilt, set at a summer-optimized angle. No adjustment for winter sun geometry.
- Loads running overnight: frost-free upright refrigerator, chest freezer, router, LED lights.
- Unit location: indoors, in a utility area adjacent to the kitchen. Temperature-stable, not exposed to the 11°F outside.
- Low charge alert at the time: set to 20 percent. Which I had set once, during setup, and never revisited.
The unit itself was not the problem. The load model was wrong, the panel tilt was not winter-ready, and the alert threshold had been calibrated against summer conditions and never updated. Three separate gaps, each invisible on its own, all showing up at once on a February morning.
What the First Morning Showed
By 7am the battery had dropped to 41 percent. I had expected to lose maybe 10 points overnight with the fridge cycling and standby loads. Losing 27 points was not in the model. The frost-free refrigerator had run its defrost cycle twice during the night, pulling a meaningfully higher load than the normal compressor draw. That was the first surprise. The second was outside.
Four inches of snow had settled on every panel. They were producing exactly zero watts. I cleared them by hand before 9am and checked the monitoring app. The number that came back was 35W. On a clear February morning, with freshly cleared panels rated at 400W total. Not a cloud in sight. The problem was not snow, and it was not the cold. It was the angle.
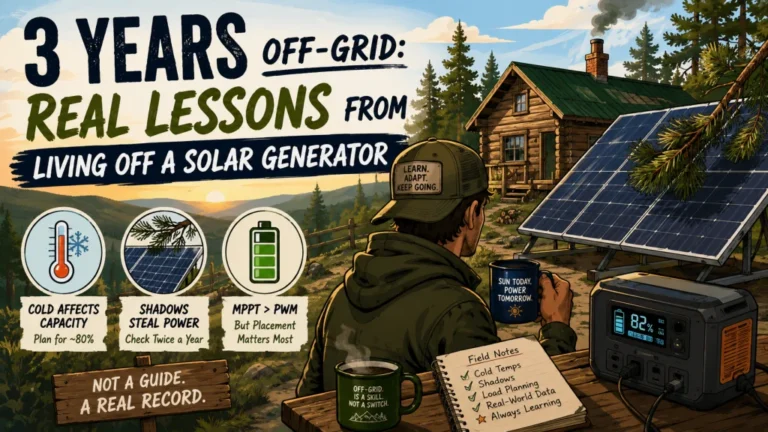
Field Note: In summer, the sun arc at my location hits fixed panels at close to 45 degrees during the productive hours. In February, that same sun tracks at closer to 15 degrees above the horizon. My panels were set at a summer-optimized tilt. At a shallow winter angle hitting a summer-pitched panel, real-world output drops hard. On that morning I was getting less than 10 percent of rated capacity from a clear sky and clean panels, not because anything was broken, but because the geometry of February had never been part of the original setup design.
The defrost cycle draw had been invisible to me because I had sized the load from the nameplate wattage on the side of the refrigerator. Nameplate specs tell you what the compressor draws when it runs. They do not include what the defrost heater adds when it cycles on. Cycling appliances never match their labels, and the only way to know the real number is to measure it across a full 24-hour period with a Kill-A-Watt meter.
The Math That Put a Clock on It
Once the panels were cleared and the monitoring settled, I did the calculation I should have done at 2:47am. My combined load at that moment was approximately 180W: the frost-free refrigerator running its normal cycle, the chest freezer, the router, and a few LED lights. Panel input was 35W. Net draw on the battery: 145W. At that rate I would hit my 20 percent reserve threshold in just under three hours. It was 9am. The outage was still ongoing with no utility estimate posted.
| Load | Estimated Draw |
|---|---|
| Frost-free refrigerator (average, with defrost) | ~120W |
| Chest freezer | ~30W |
| Router | ~10W |
| LED lights | ~20W |
| Total load | ~180W |
| Panel input (February, fixed summer tilt, clear sky, 400W rated) | 35W |
| Net battery draw | 145W |
Three hours sounds like nothing when it is 9am, the panels are producing a fraction of their rating, and there is no utility estimate in sight. By noon the battery would be at reserve. By early afternoon I would be in triage. That is when I walked over to my neighbor’s property.
What Saved the Situation
My neighbor two properties over keeps a small gas generator for situations like this. He had it running for his own place. I had a heavy-duty extension cord long enough to reach him and asked if I could plug into his AC output for a wall charge on my unit. One 90-minute run, with my unit pulling a full AC charge rate, brought me from 22 percent back to 80 percent. I disconnected, thanked him, and ran on solar and battery for the next 14 hours without touching reserve again. The grid came back early the following morning. I finished that outage at 52 percent.
The situation was managed. But it was managed by borrowing infrastructure from a neighbor, not by the setup I had designed. There is a difference. A solar setup that holds together because a neighbor happened to have a gas generator running is a setup with a hidden dependency I had not planned for. I spent the rest of that week going through every assumption in the design and figuring out which ones would not survive a repeat.
If he had not been home, the next move would have been to shut down every non-food load, pull the refrigerator off continuous duty, and keep the freezer alive first. Not a comfortable plan. A triage plan. I have thought about that scenario a lot since, because it is the scenario that reveals whether a setup is genuinely prepared or just lucky. The point of every change I made afterward was to avoid ever being forced into that triage again, not only by adding capacity, but by removing the gaps that created the emergency in the first place.
What I Changed After
The February outage identified five specific gaps. Not vague areas for improvement. Five concrete things I could fix before the next winter arrived.
- Added a second tiltable panel mount. The fixed summer-angle array stays as the primary setup. The adjustable mount gets reset to a steep winter angle each November. The difference in December and February production compared to the fixed array alone is significant enough to matter when production hours are short and the load does not stop.
- Added a long-handle snow brush to the kit. It lives next to the unit from November through March. Clearing four inches off a fixed panel array is a five-minute job with the right tool. Without it, clearing panels in 11°F weather at 7am is a miserable project that takes much longer and gets skipped more often than it should.
- Moved the low charge alert threshold from 20 percent to 35 percent. Twenty percent felt like a safe reserve in summer with long production days. In winter, 20 percent is the point where you are already inside the problem. Thirty-five percent gives time to act before the math gets uncomfortable.
- Replaced the frost-free refrigerator with a manual-defrost chest freezer. The defrost cycle is the hidden load that most people using nameplate specs never catch. A chest freezer without automatic defrost eliminates the overnight load spikes entirely and runs at a lower average draw. It is also more efficient at holding temperature because cold air does not pour out the front every time you open it.
- Measured every load with a Kill-A-Watt meter before the following winter. Not nameplate ratings. Actual draws across full 24-hour cycles for everything in the setup. Every number I measured was different from what the label said, and not in the direction I would have preferred.
None of these changes required buying a larger unit or spending significant money. The adjustable mount was the only real cost. The rest was measuring, repositioning, and changing one appliance I needed to replace anyway. The point is not that the original setup was poorly chosen. The point is that a setup tested through summer has not been tested through winter, and the difference between the two is enough to matter when the power goes out at 11°F at 2:47 in the morning.
Part of what made the February outage so instructive is how much of it came down to panel output assumptions that only applied to summer conditions. The actual numbers for low-angle winter sun, cloudy days, and snow recovery are different enough from rated specs that they deserve their own understanding. How panel output actually behaves under overcast skies and low winter sun is one of the most skipped parts of setup planning, and it is usually skipped by people who bought and set up their system in July.
What the Data Says About Why Any of This Matters
The EIA Electric Power Annual 2024 reported that US electricity customers averaged 11 hours of power interruptions in 2024, nearly double the average of the previous decade. Hurricanes Beryl and Helene drove much of that number at the national level. But the trend is not only hurricane-related. The data going back to 2013 shows a clear shift in the frequency and duration of major weather-driven outage events. For customers in rural areas, regions with aging distribution infrastructure, or areas that get hard winters, the national average understates the real exposure.
My February outage was not a hurricane. It was a standard rural Nevada winter event. The grid went down and came back 28 hours later. What made it manageable was partly the setup and partly luck in the form of a neighbor with a running generator. After that night I stopped thinking about backup power as a battery-size question only. I started judging any setup by four things: winter panel input rate, measured overnight load, reserve threshold, and whether there was a second way to charge. Planning for an outage that solar and a supplemental charge source together can genuinely handle is a different exercise than planning for a one-day summer bump. What makes a setup capable of surviving a multi-day outage in genuinely difficult conditions involves those same four variables, and February is when all of them get tested at once.
Final Thoughts: What a Bad February Night Actually Teaches You
I have not had a winter outage problem since. Not because I bought better hardware. Because one bad night showed me exactly where the setup was wrong, and I fixed the specific things that were wrong. The adjustable mount. The snow brush. The 35 percent alert threshold. The chest freezer. The measured loads. Each of those five changes came directly out of that February event, and none of them required guessing. The outage showed me precisely what to fix.
What changed after that night was not my confidence in solar. It was my tolerance for unmeasured variables. Measure your actual appliance draws. Check your panel angle against February sun geometry at your location. Set your low charge alert higher than feels comfortable. The margin that looked safe on a long August day is not the same margin in February at a 15-degree sun angle with snow on the panels. The setup that kept you comfortable all summer may be thinner than you think, and winter has a reliable way of showing you exactly how thin.
Sources and References
- U.S. Energy Information Administration. Electric Power Annual 2024. Available at: eia.gov: Today in Energy: Electric Power Annual 2024
- Utility Dive. “Hurricanes drove US power outage spike in 2024, EIA data shows.” December 2025. Available at: utilitydive.com: Hurricane outage electricity analysis
- National Renewable Energy Laboratory. Solar resource data and sun angle modeling tools. Available at: nrel.gov
FAQs
❄️ Why does my solar generator charge so slowly in winter?
Low sun angles in winter mean your panels receive sunlight at a much shallower angle than in summer, cutting real-world output significantly even on clear days. Fixed-tilt arrays set for summer lose the most. Snow on the panels makes it worse. Clearing panels promptly and adjusting tilt to match winter sun elevation makes a measurable difference in daily production.
🌡️ Does cold weather damage a solar generator battery?
LiFePO4 batteries handle cold better than NMC lithium but still deliver reduced capacity and slower charge rates below freezing. Most manufacturers recommend charging only above 32 degrees F. Discharging in cold is generally safer than charging in cold. Keep the unit indoors during winter outages if at all possible, and check the manufacturer’s cold-weather specs for your specific unit.
🔌 Can I charge a solar generator from a neighbor’s gas generator?
Yes, using the AC wall input. Most solar generators accept standard 120V AC from any generator that produces stable output. Check your unit’s AC input specs and wattage limit first. A 90-minute AC charge session can bring a depleted battery back to a workable state considerably faster than winter solar alone can manage on a short production day.
🧊 Why does my refrigerator draw more power than the label says?
Frost-free refrigerators run a defrost heater on a timer, typically every 6 to 8 hours. That cycle adds load on top of the compressor draw and is not included in the nameplate wattage. Measure actual draw with a Kill-A-Watt meter across a full 24-hour period to get a real number for sizing. The difference between the label and the real draw is often 20 to 40 percent higher than expected.
📐 What solar panel tilt angle works best in winter?
A steeper tilt than summer is needed. A rough starting point: add 15 to 20 degrees to your summer tilt angle for winter months. The optimal winter angle is approximately your latitude plus 15 degrees. Adjustable mounts make this practical without buying additional panels. Fixed summer-angle arrays will underperform meaningfully from November through February across most US locations.
⚡ How much reserve should I keep in winter outages?
Higher than summer. A 20 percent floor works when production days are long and you can recharge quickly. In winter, production rates are lower and outages tend to run longer. A 35 percent low-charge alert gives you time to act before you are in a difficult position. If you have a secondary charging option available, use it before you hit the threshold, not after.