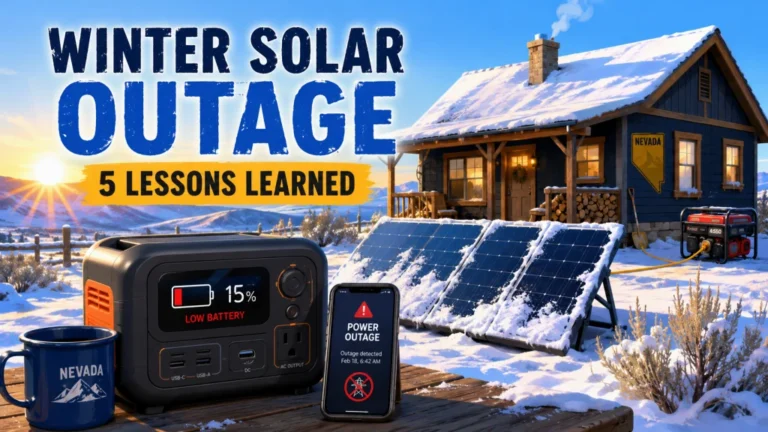
Three years ago I left a retail job selling solar generators and moved to a 12-acre property in rural Nevada where I had to actually live off one. I thought my experience at the counter would translate cleanly into off-grid life. It mostly did, except for the parts that humbled me. This is not a guide. It is a record of what surprised me, what failed me, and what I had to learn the slow way that no spec sheet was ever going to teach.
Leaving the Counter for the Off-Grid Life
In the spring I left the retail shop I had managed for six years and moved to a 12-acre property in rural Nevada. I had sold hundreds of solar generators by that point. I had explained watt-hours to confused buyers every single week. Surge ratings, MPPT vs PWM controllers, LiFePO4 cycle counts, real-world charging time under partially cloudy conditions. I had it down. I was confident in a way that, looking back, only someone who had never depended on the thing could afford to be.
The first time I woke up at 5 AM to check whether overnight battery draw had pushed below 20 percent, I understood something I could not have learned at the counter. Selling a product and living off a product are not the same education. The retail version of me had been explaining a subject he had field-tested in a controlled, air-conditioned showroom. The homestead version of me started keeping notes from week one. This article is what those notes added up to over three years.
Not a buying guide. Not a sizing formula. Just an honest account of where the spec sheet stopped and reality started.
What I Thought I Knew, and What Year One Actually Looked Like
The 85 percent efficiency factor I had quoted customers for years turned out to be accurate. I measured it. On a clear July afternoon with my panels at optimal angle, the system was pulling right around 84 to 86 percent of rated panel wattage into the battery. That part I had right. What no spec sheet shows is what happens to that same number in January when the ambient temperature drops to 18°F in rural Nevada.
At that temperature my LiFePO4 battery was charging noticeably slower than at room temperature. Not failing. Not damaged. Just slower, and with a narrower effective usable range than the rated capacity suggested. LiFePO4 handles cold significantly better than NMC lithium chemistry, but “better” is not “unaffected.” The unit still performed. I just had to plan around the fact that January mornings meant reduced charge acceptance, which meant the first few hours of solar production were going into a battery that wasn’t absorbing at full rated rate.
I had told customers this in theory. I had never felt it as an operational constraint before. There is a difference, and the difference is larger than you expect until you are the one deciding whether to run the coffee maker.
The Cold-Weather Adjustment Nobody Mentions
The practical fix I landed on was treating my usable capacity as roughly 80 percent of the nameplate figure during sustained cold months, and sizing my daily load planning around that lower number instead of the rated spec. It worked well once I made the adjustment. But it required a mental recalibration I had never thought to offer a single buyer at the shop. The capacity printed on the box is measured at room temperature under controlled conditions. A Nevada February is neither of those things, and the gap between the two is real enough to affect your planning if you are actually depending on the unit.
The Day a Single Pine Branch Cost Me Two Days of Charging
My first winter on the property I lost two full days of useful charging because a single pine branch was casting a shadow on one cell of one panel. The property sits on the higher, tree-lined edge of the valley, and the panels are set back from the main structure where the juniper and pine start. Not the whole panel. One cell. I had an MPPT controller, which handles partial shade meaningfully better than a PWM setup, but I had not accounted for the cumulative effect a moving shadow has across the full arc of a winter day at low solar elevation.
Here is what actually happens: the shadow moves with the sun, but in winter the sun’s arc is lower and slower. In summer, a branch might graze a corner of a panel for an hour and then clear. In December, that same branch sat on the same cell for most of the viable charging window. The MPPT controller compensated, but only so much. My daily yield dropped by roughly 30 percent across those two days before I figured out the cause, went outside, and trimmed the branch. Ten minutes of work. Two days to notice the problem.
Field Note: Panel placement is not a one-time decision on a homestead. The sun angle shifts by season, trees grow, and the shadow that did not exist in July can show up in December. I walk my array twice a year now, once in early summer and once in late fall, specifically looking for new obstructions. It takes less than 15 minutes and has saved me from repeating the pine branch situation.
What this taught me is that MPPT over PWM matters, always, for any fixed installation. But even the best controller cannot fully compensate for a shadow that sits stationary on a cell all day. The solution is placement and seasonal maintenance, not controller technology. I mention this because it is exactly the kind of thing that does not come up in a retail conversation. You are not thinking about where a December shadow might fall when you are buying in June.
Why My Refrigerator Surprised Me More Than the Freezer
I expected the chest freezer to be the load that required the most attention. It was not. The frost-free upright refrigerator in the kitchen was drawing more average power than I had modeled, and it took a Kill-A-Watt meter running for a full week to understand exactly why.
The nameplate on the back of that refrigerator listed 150 watts. That number is accurate when the compressor is running in its normal cycle. What the nameplate does not list is the defrost cycle. Frost-free refrigerators run a resistive heating element periodically to clear ice buildup from the evaporator coils, and that cycle drew between 350 and 400 watts for roughly 20 minutes every several hours. Over a full week of metering, that older full-size refrigerator used approximately 3.8 to 4.5 kWh per day, which works out to an average draw closer to 160 to 185 watts, not 150. That is a 10 to 25 percent gap between the nameplate and what actually came out of my battery.
| Appliance | Nameplate / Listed Draw | Measured Real Average (over 24 hours) | Estimated Daily Use (Wh) |
|---|---|---|---|
| Frost-free upright refrigerator | 150W | ~170W avg (defrost cycle raises average) | ~4,100 Wh |
| Chest freezer (no frost-free cycle) | 100W | ~90W (runs below nameplate on average) | ~2,160 Wh |
| LED lighting (6 fixtures) | 54W total | ~54W (matches nameplate) | ~270 Wh (5h use) |
| Phone and laptop charging | 65W combined estimate | ~50W (duty cycle lower than modeled) | ~150 Wh (3h use) |
The chest freezer, by contrast, had no defrost cycle and averaged slightly below its nameplate over 24 hours. Compressor on, compressor off, predictable cycling. That is the appliance I had worried about. The refrigerator was the one quietly running up the tab.
The lesson I took from this is straightforward: for any appliance with a cycling load, a heating element, or a motor-driven compressor, treat the nameplate wattage as a floor, not a ceiling. Then meter it for a week before you finalize any load calculations. A Kill-A-Watt meter costs around $25 and will give you data that no product page, spec sheet, or forum estimate will. If I had run this measurement before sizing my system instead of after, year one would have looked different.
Year Two: The Battery Degradation Check
At about 18 months into full-time daily cycling I ran a runtime test on the battery to put a number on where actual capacity stood. The method is not complicated: charge to 100 percent, apply a known steady load, measure how long it takes to reach 20 percent, and calculate from there. No special equipment beyond a Kill-A-Watt meter and a consistent load, like a space heater on a low setting or a lamp array you have already measured.
The result was approximately 94 percent of original rated capacity at 18 months. I had been cycling at around 80 percent depth of discharge daily, which is on the more aggressive end of regular use, and the unit was still delivering 94 percent of its original spec. For LiFePO4 chemistry, that is well within normal performance. Published cycle life data for LiFePO4 cells puts meaningful degradation at around 2,000 to 3,500 cycles under typical conditions, with roughly 20 percent capacity loss at the high end of that range. At 18 months of daily cycling I was nowhere near 2,000 cycles, so 94 percent was actually slightly better than I expected given the depth I was running it to each day.
- Result at 18 months: approximately 94% of original rated capacity remaining
- Cycle depth used: roughly 80% depth of discharge per day
- Chemistry: LiFePO4, with published ratings of 2,000 to 3,500+ cycles depending on discharge depth
- Practical implication: at this degradation rate, meaningful capacity loss was still several years out under the same usage pattern
Compare that to what I had been watching at the shop with units running NMC lithium chemistry. Capacity complaints at 18 months were not uncommon on those units. The chemistry difference between NMC and LiFePO4 is not a marketing distinction. It shows up in real daily-use data over time. For anyone who wants the full picture of what this degradation curve looks like and how to track it over time, I cover the LiFePO4 battery degradation pattern and the runtime test method in detail separately, because it deserves more space than a few paragraphs here.
The short version: if you are running LiFePO4 and cycling it responsibly, the long-term performance holds up. My data at 18 months confirmed what the chemistry literature predicts. That was reassuring in a way that no amount of reading spec sheets had been before I had the numbers from my own unit.
The Margin Lesson: The One Thing Three Years Taught Me That No Spec Sheet Will
If I had to compress three years of homestead experience into a single principle, it is this: a system sized for your load is not enough. You need margin. Specifically, you need 20 to 30 percent more capacity than your modeled daily load, and that number is not conservative guessing. It comes from what actually happens on the days that are not optimal.
On a clear August afternoon with panels at full angle, my system runs comfortably. I have headroom to spare and the battery tops off before noon. Those days are not the ones that matter. The days that matter are the ones in February when cloud cover rolls in for three days, the sun angle is low, the battery is absorbing charge at 80 percent of its warm-weather rate, and the chest freezer compressor decides to kick on hard at 6 AM when the battery is already at 35 percent. A system sized exactly to your modeled load fails you on those days. A system with 20 to 30 percent headroom handles it without drama.
My original setup was sized too tightly. I had modeled my loads accurately. I accounted for the 85 percent solar efficiency factor. I did not account for the combination arriving simultaneously: reduced winter solar production, cold-weather charge acceptance, and a load spike at the worst possible moment. On paper, a 2,000 Wh system handling a 1,600 Wh daily load looks fine. In practice, on a February morning with three cloudy days behind it, that system was making me nervous in a way I had never anticipated.
Key point: The right sizing question is not “does my system cover my average daily load?” It is “does my system cover my daily load on my worst realistic day, with 20 to 30 percent on top of that?” If the answer is no, the system is undersized for real-world conditions even if it looks correct on paper.
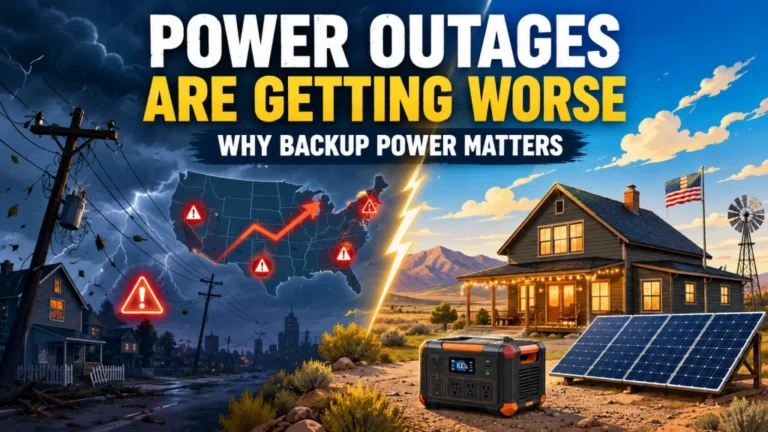
According to the U.S. Energy Information Administration, American electricity customers averaged 11 hours of power interruptions in 2024, nearly double the average of the previous decade. That sentence only became comfortable for me after I stopped sizing my system for average days and started sizing it for the worst realistic ones. For me, over three years, every one of those 11 annual hours was not an outage. It was just Tuesday. Not an emergency, not a scramble, just the system doing its job quietly because the margin was there. The full approach to sizing a solar generator with the right headroom built in is worth going through carefully, because the math is not complicated but the real-world factors are easy to undercount if you have never lived off the system before.
What I Actually Changed After Year One
Recognizing the problem is not the same as fixing it. After year one I made a set of concrete adjustments that changed how I operated the system every single day, and most of them cost nothing.
The first thing I changed was my battery floor. I stopped treating 20 percent as my safe reserve and moved that line to 35 percent. Keeping a larger floor meant I was never starting a cloudy morning from a depleted position. It also meant I had to be more deliberate about when I ran the bigger loads. The microwave, the coffee maker, the one load of laundry per week: those moved to midday, when the panels were at peak and the battery had already been climbing for a few hours. It sounds like a small shift in routine. In practice it changed the whole feel of operating the system from reactive to planned.
The second change was adding panel capacity. Not replacing the original array. Expanding it. More surface area meant more tolerance for the days when the sun angle was low or the sky was partly clouded. It also meant the battery was reaching full charge earlier in the day on good days, which gave me headroom for the late afternoon loads I had not been able to run comfortably before. That expansion was the single most impactful change I made after year one, and I should have done it from the start.
The third change was the twice-yearly panel walk I mentioned in the shadow section. Fifteen minutes. Once in late spring, once before winter. That habit has cost me nothing and prevented at least two more lost charging days that I know of.
Note: None of these adjustments required buying a new unit. They required changing how I thought about the system. The hardware was adequate. My planning assumptions were not. That distinction matters for anyone who is already running a system and wondering why it feels tighter than it should.
Final Thoughts: I Don’t Regret Leaving the Shop. I Regret the Undersizing.
Three years in, the homestead runs. The system works. The battery held up better than I expected. The lessons cost me some anxious mornings in year one and a pine branch trimming in December, and I consider that a reasonable price for what I learned.
The thing I would tell anyone standing at the edge of this decision, or anyone who already has a solar generator and suspects they may have sized it too tightly, is this: the spec sheet tells you what is possible under optimal conditions. Real life is February cloud cover and defrost cycles and pine branch shadows and a battery absorbing charge at 80 percent of its rated rate because it is cold. Those are not edge cases. They are the regular conditions you plan around if you are actually depending on the system.
I do not regret moving. I regret not starting with a larger unit in year one. It would have cost more upfront. It would have cost a great deal less in 5 AM battery checks and mental overhead on cloudy winter weeks. That is the trade I understand now that I did not understand then, and no retail experience was going to give it to me. Only living off the thing could do that.
Sources and References
- U.S. Energy Information Administration. Electric Power Annual 2024. U.S. Department of Energy. Data on average annual electricity interruption duration per U.S. customer. Reported via Utility Dive, December 2025.
- National Renewable Energy Laboratory. PVWatts Calculator and Solar Resource Data. NREL.gov. Reference for real-world solar panel output vs. rated wattage under varying conditions including partial cloud cover and seasonal sun angle.
- Buchmann, I. Types of Lithium-Ion. Battery University, Cadex Electronics. Cycle life and capacity fade benchmarks for LiFePO4 vs. NMC lithium-ion chemistry, including published ratings of 2,000 to 3,500+ cycles for LiFePO4 and 500 to 1,500 cycles for NMC under standard discharge conditions.
FAQs
🌡️ Does cold weather really reduce how much a solar generator battery can hold?
Yes, and the effect is real at temperatures below about 32°F. LiFePO4 chemistry handles cold better than NMC, but charge acceptance slows and usable capacity narrows in sustained cold. A practical rule of thumb for cold-weather planning is to treat usable capacity as roughly 80 percent of the nameplate figure rather than the full rated number.
🌲 How much can a shadow on one panel cell actually affect output?
More than most people expect. A shadow on a single cell creates a bottleneck that affects the entire string, not just the shaded portion. An MPPT controller mitigates this better than PWM, but a stationary shadow sitting on the same cell for most of the charging window can still cut daily yield by 25 to 40 percent. Placement and seasonal maintenance matter more than the controller alone.
🔋 How do I check if my solar generator battery is degrading over time?
Run a runtime test: charge to 100 percent, apply a known steady load, and measure how long it takes to reach 20 percent. Compare against the unit’s rated capacity to calculate what percentage it is actually delivering. For LiFePO4, a 5 to 8 percent drop after a year of daily cycling is normal. More than 15 to 20 percent loss within the first year or two is worth investigating.
🧊 Is a chest freezer or an upright refrigerator more efficient for off-grid use?
For off-grid use, a chest freezer is generally more predictable and draws less on average. Frost-free upright refrigerators run a defrost heating cycle that adds meaningful watt-hours beyond the nameplate draw. If you are planning a solar generator load around a refrigerator, meter it with a Kill-A-Watt meter for a full week before finalizing your numbers. The measured average draw is often 25 to 35 percent higher than the spec sheet suggests.
📐 How much extra capacity should I add when sizing a solar generator for off-grid use?
At minimum 20 percent above your modeled daily load, and 30 percent is more comfortable. This covers reduced winter solar output, cold-weather battery charge acceptance loss, and appliance load spikes from compressor cycling. A system sized exactly to your calculated load works fine in optimal conditions and creates problems on the days that are not optimal, which are the days that matter most.